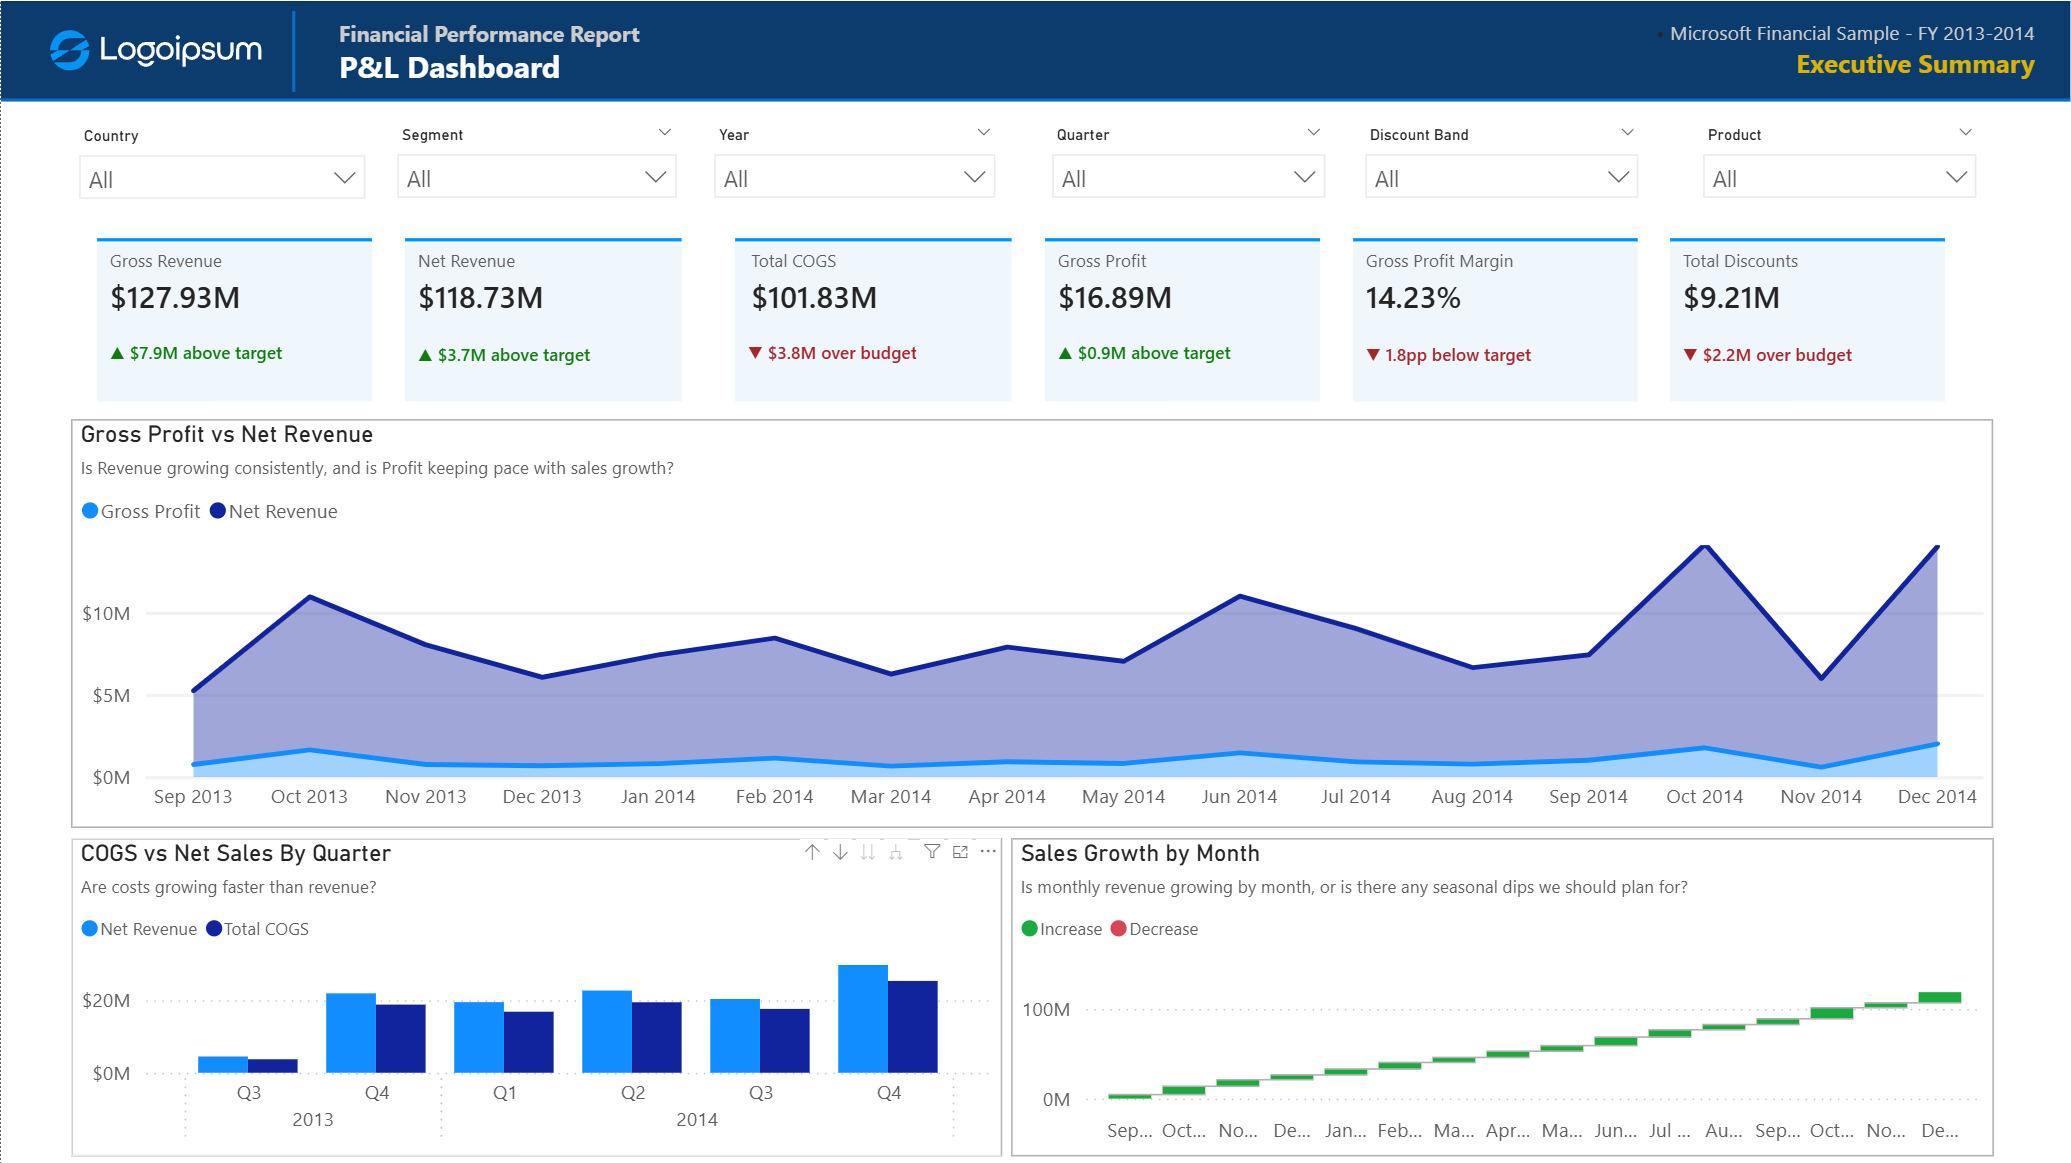
 Executive Summary Page
Recently, I have grown an interest in getting deeper into the finance world, so I thought it would be a good idea to acquire the knowledge by connecting it with my day-to-day work with data by building a Power BI finance report from scratch for a weekend project.
The report uses the Microsoft Financial Sample dataset, covering a multi-region company’s revenue, costs, and expenses over the period from September 2013 to December 2014.
Why I think it would be helpful to turn this into a dashboard:
Reusable internal reporting asset: One of the core values of a P&L dashboard is the ability to compare performance across accounting periods: monthly, quarterly, and year over year, without rebuilding the analysis each time. Once connected to a company’s data warehouse or ERP system (SAP/Snowflake), this dashboard becomes a reusable internal reporting asset that refreshes automatically with live data.
Interactivity (drill through / slicers): Static Excel reports answer questions from a fixed level of details standpoint, while dashboards allow users to filter based on categories (products/ segment/locations), and comfortably navigate between different levels of details (high level visualizations → drill through to detailed P&L statement records).
⇒ Executives can answer ad-hoc questions about revenue trends, discount pressure, and margin performance at any time, eliminating the delay and manual effort of the traditional Excel-based reporting cycle.
About the dataset
The initial dataset was a single, flat excel file that contains pre calculated columns (gross sales, discounts, sales, COGS, and profit), with unit level input (sale price, manufacturing price, units sold) and aggregated outputs.
The dataset begins from September 2013 to December 2014 → only 4 months of 2013 are present, so year-over-year comparison should be interpreted with this in mind, or should be filtered to complete years only.
The dataset covers gross profit layer of P&L from gross revenue to gross profit margin. However, certain limits of this dataset for a P&L dashboard include:
No operating expenses breakdown (rent/salaries/marketing/R&D, etc..) No cost breakdown within COGS. No Budgets / Actuals from source. No pricing history for sale / manufacturing price changes Segment-level data is available, but not account-level data. → Core KPIs of an enterprise-level P&L dashboard (EBIT, EBITDA, net profit after interest/tax ) can not be calculated in this dashboard because of these limitations.
Data Preparation
Data quality checks:
- Make sure there are no negative profits
- Currency columns have the correct currency data type
- Correct Australian Date format (dd/mm/yyyy)
- Checking null values
Data modelling:
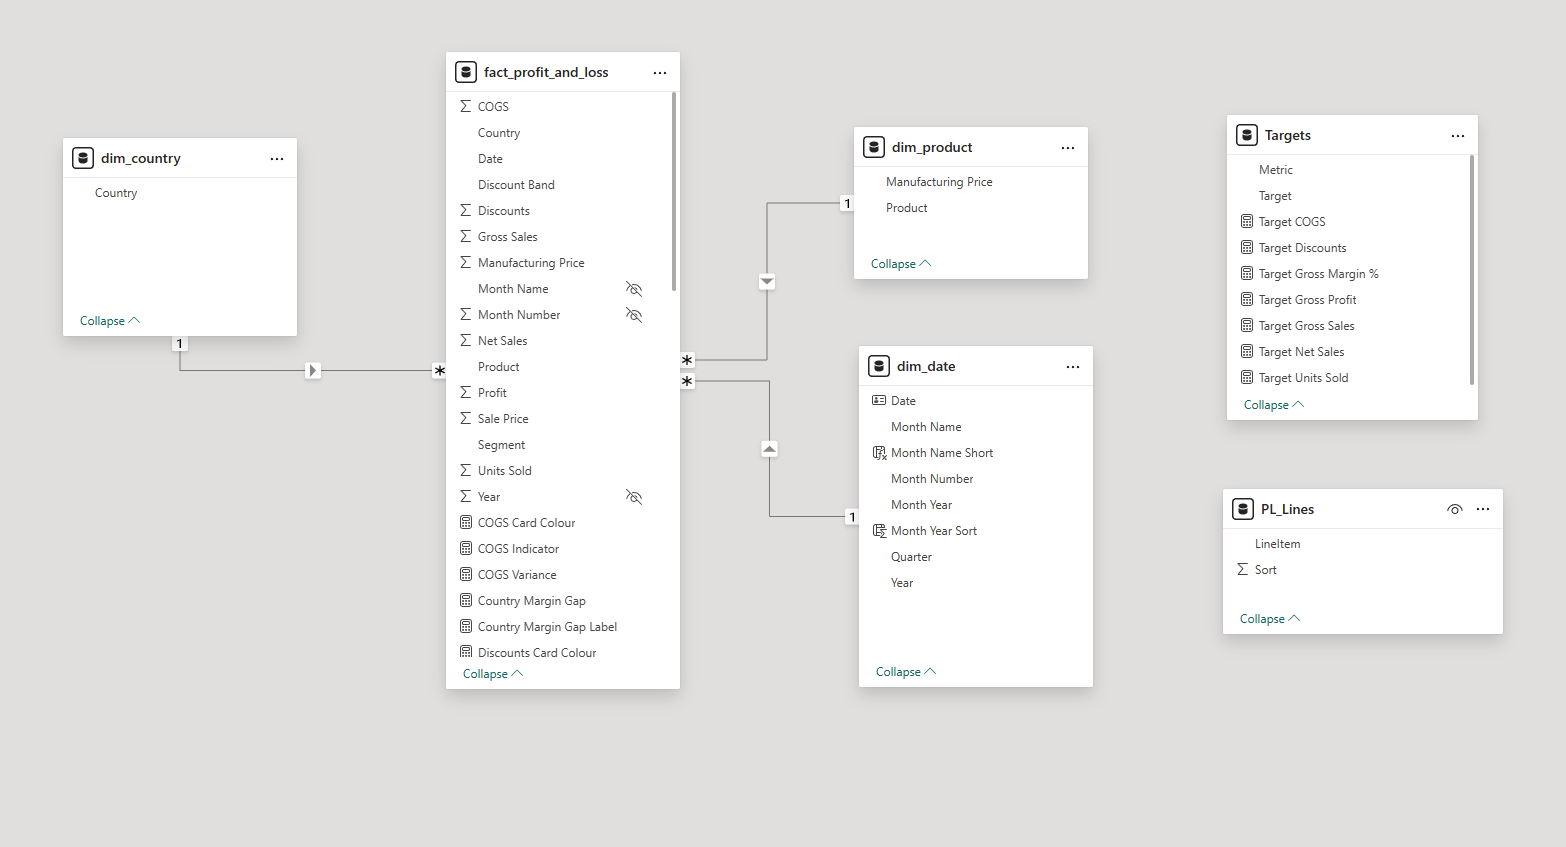 Data Model Implemented
- The raw flat table was transformed into a star schema (follow PowerBI best practice) during the modelling phase:
- Separating descriptive attributes from the fact table: dim_country, dim_product.
- Create a separate dim_date: enable time intelligence DAX — complete, contiguous calendar dimension. Every month appears, and gaps are accurately reflected as zeros. Date dimension will also be updated (by min/max date) when new data arrives in the future.
- Remove redundant columns: default month name, month number, year from fact_table.
- Create an additional targets table (mock values) for a more complete report.
Building the PowerBI report
Executive summary:
- Provides a top-level view of business performance for stakeholders that want access to quick insights about the business financial health. Press enter or click to view image in full size
Executive sumamry page
Key insights:
- Business maintained steady sales growth over time; however, discounts ran $2.2M over budget, which indicates that the business is buying volume at the cost of efficiency.
Segment & Products
- Analyze performance across different segments and products through sales volume, revenue, and profit margin.
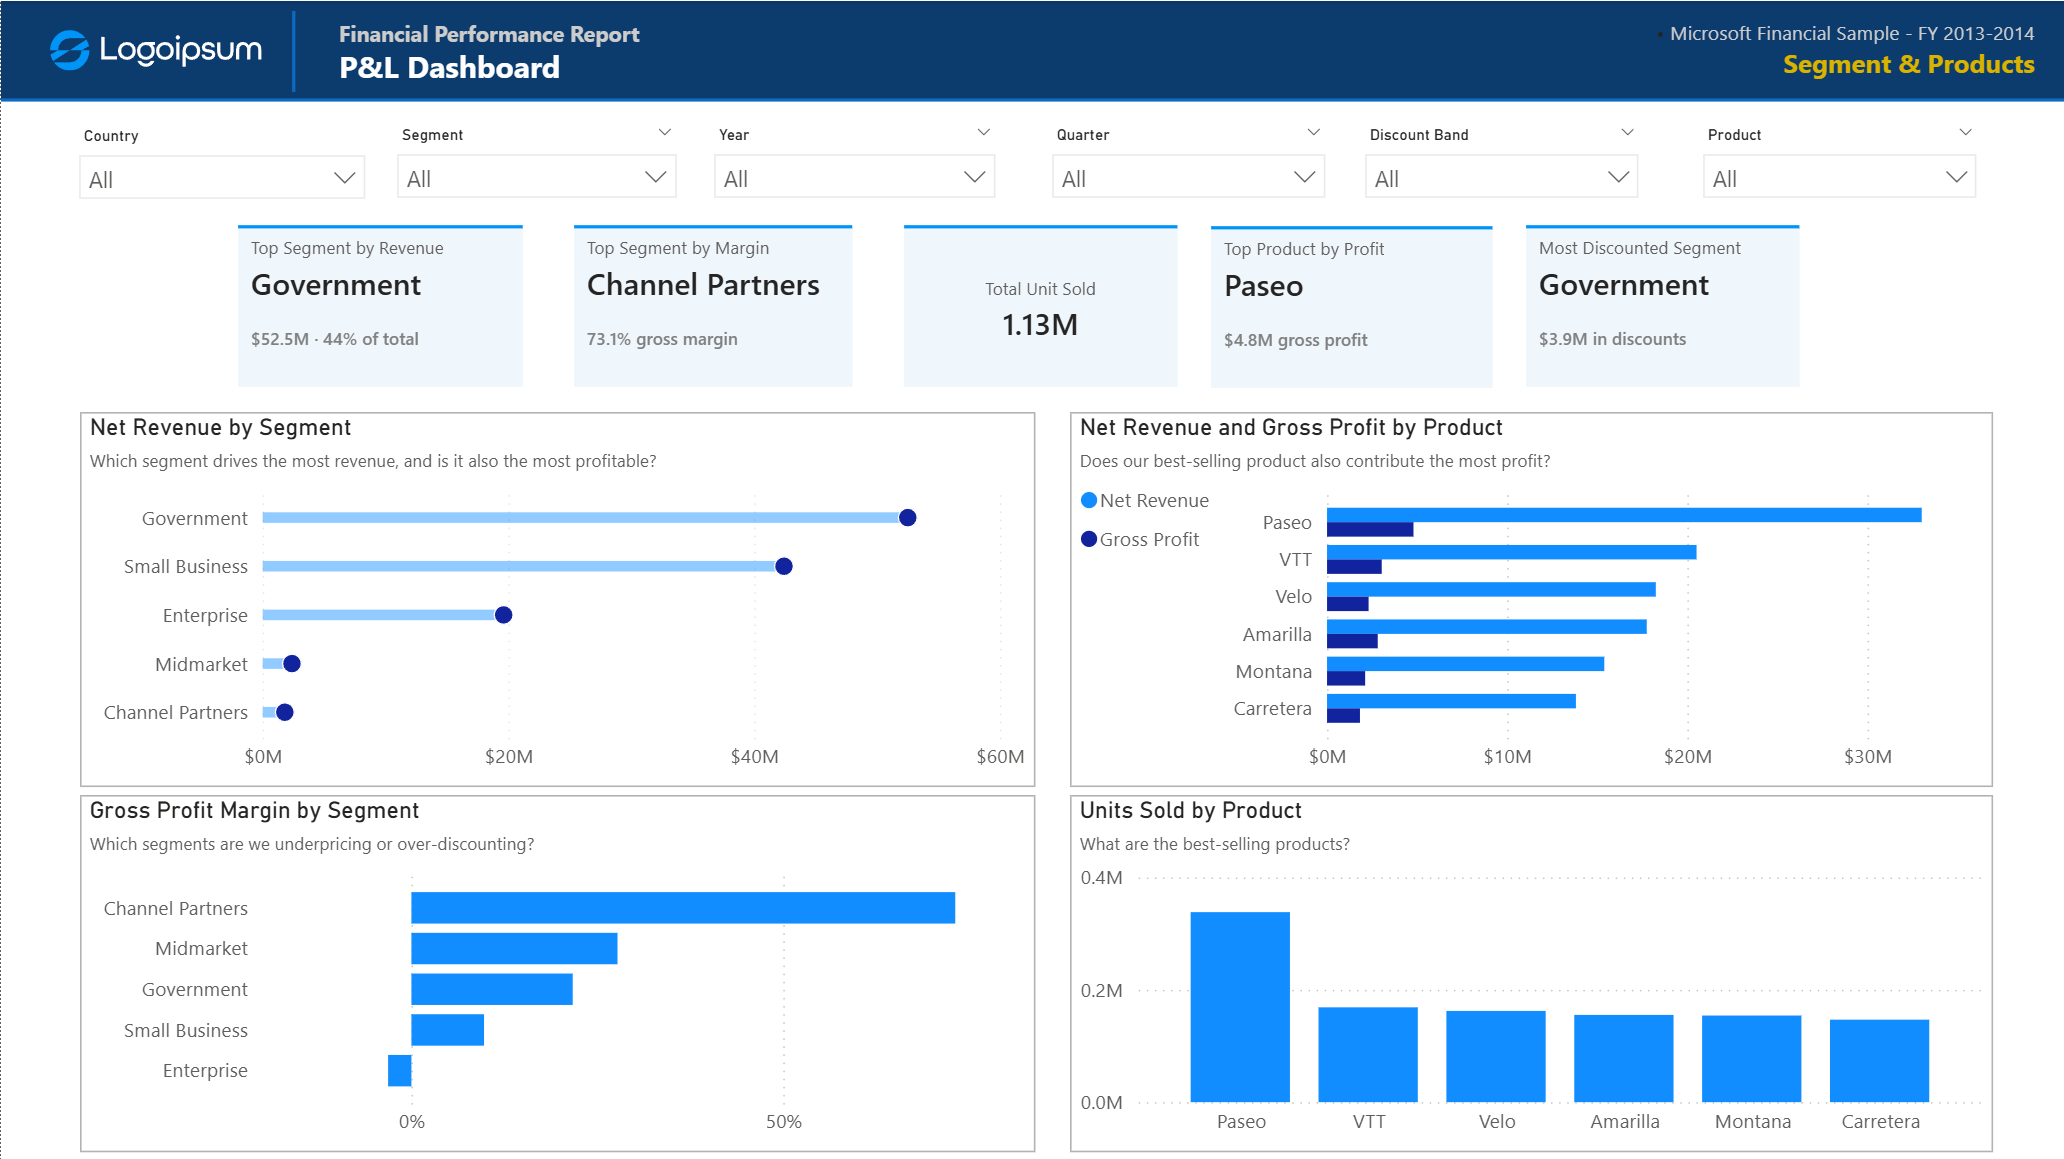 Segment & Products Page
Key insights:
- Government was the top segment by revenue ($52.5M), contributed to 44% of total revenue in this period, but was also the most discounted segment.
- Paseo was the best performing product, by both sales volume and gross profit, making it the most valuable product in the company’s portfolio.
Geographic
- Analyse performance across different markets globally.
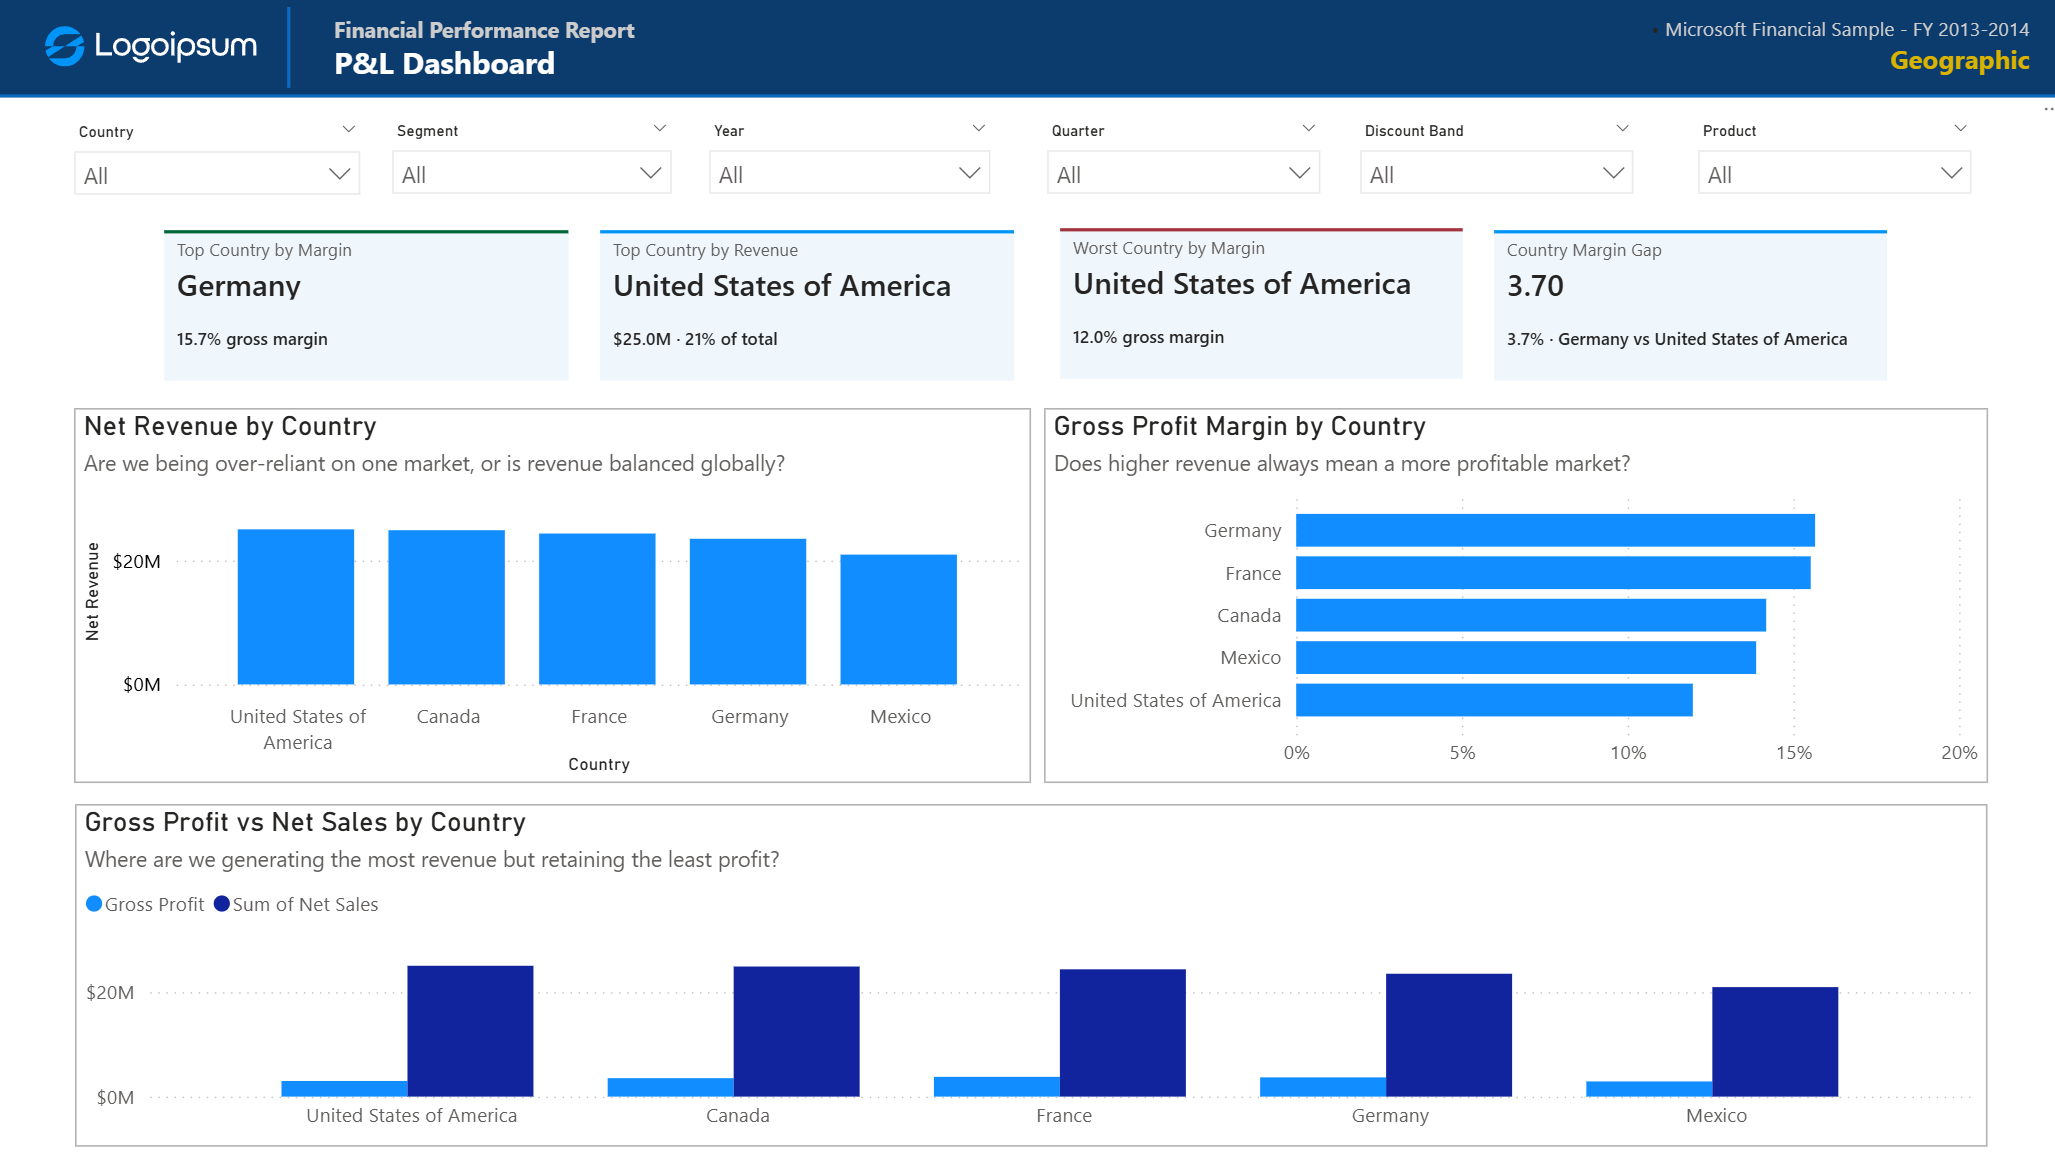 Geographic Page
Key insights:
- Sales are distributed evenly across different markets, in terms of both revenue and profit margin.
P&L Statement
- A matrix visual showing the full P&L chain, broken down by months across the given period, for stakeholders that requires detailed numbers behind the charts.
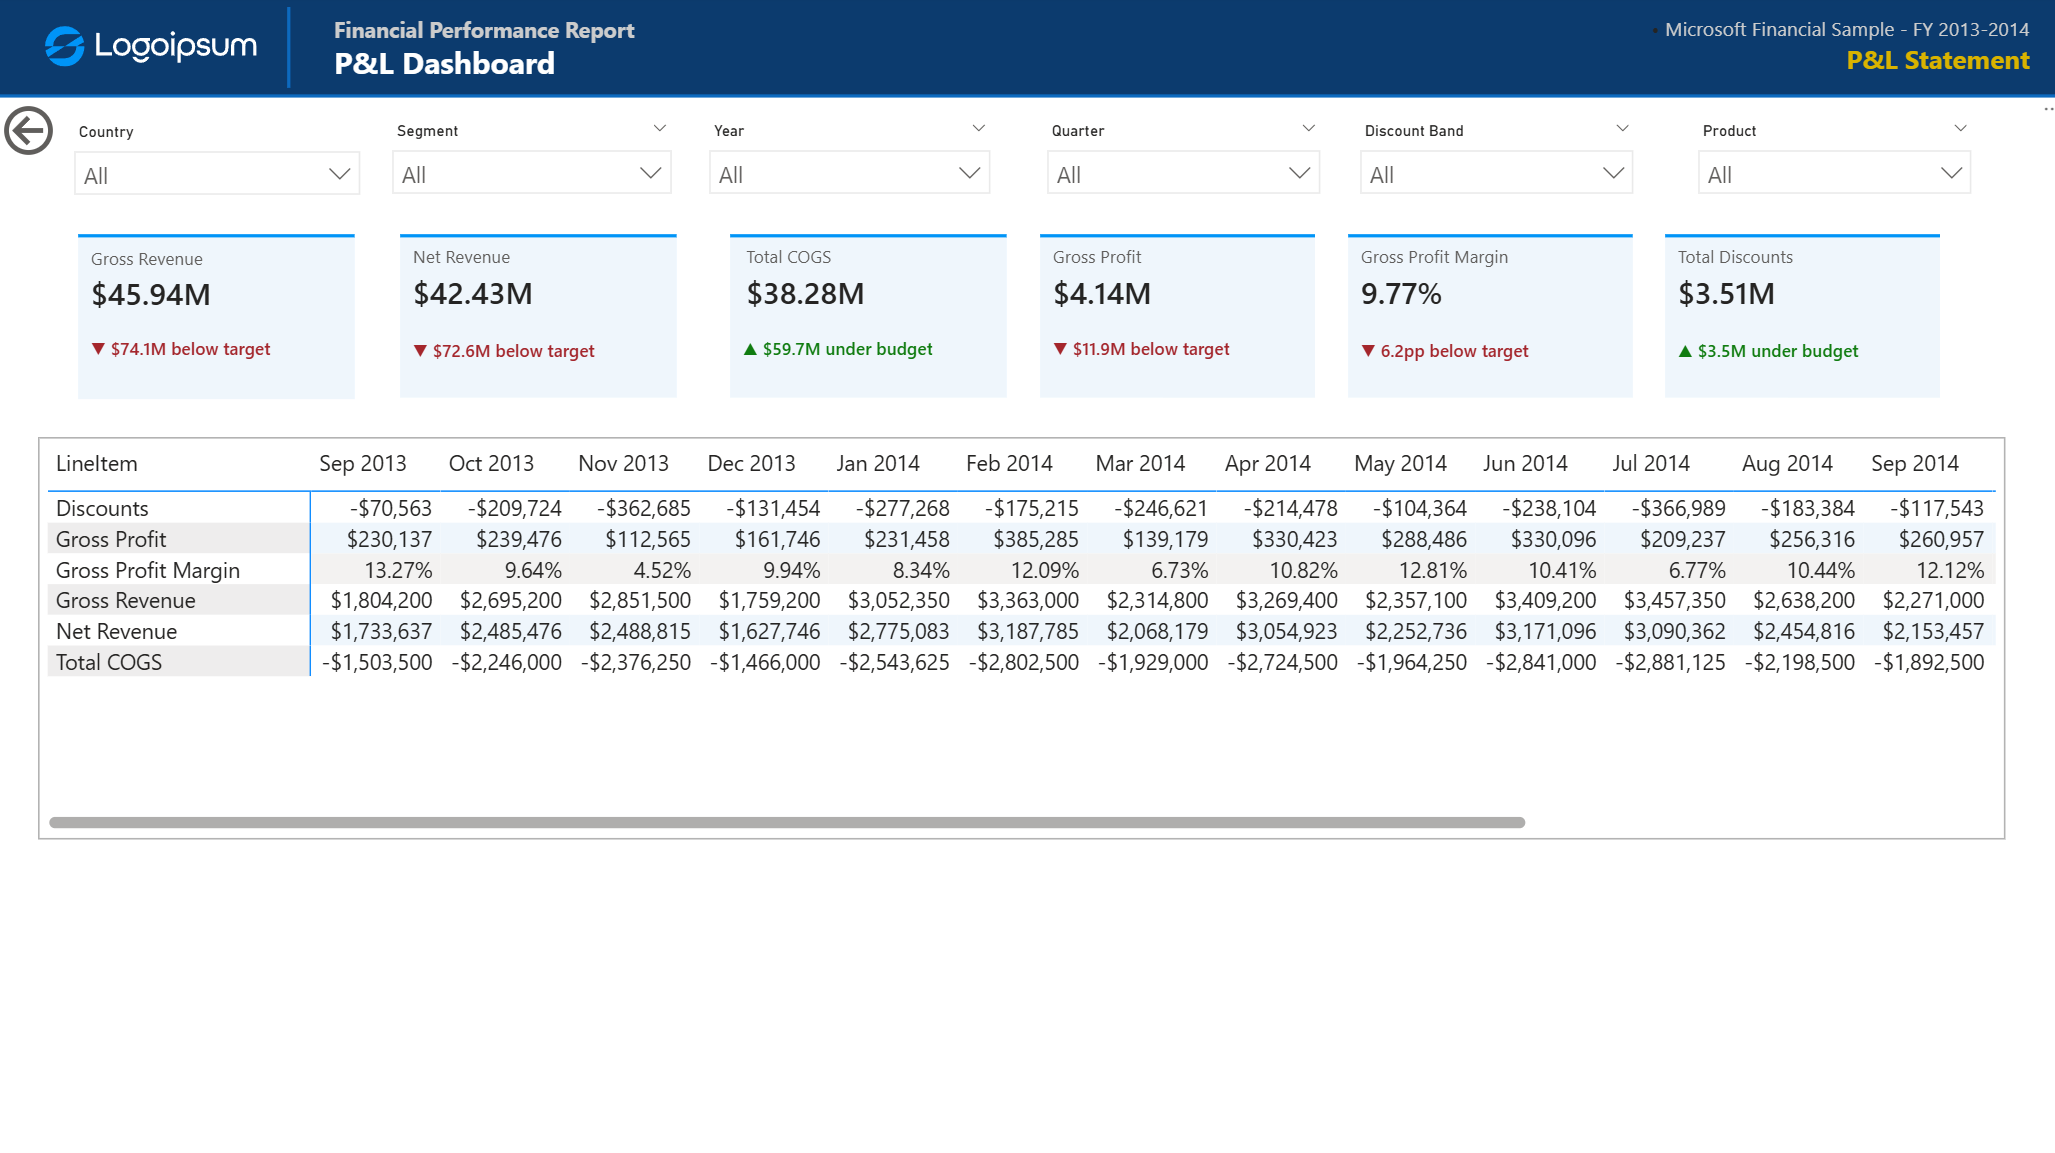 P&L Statement Page
Drilldowns: Any visuals have the option to drill down to the detailed P&L statement on the final page. For example, a user can drill down a segment from the segment dashboard to see the discounts, gross profit margin, gross and net revenue of that segment over each month by right-clicking the segment on a visual in page 2, and select drill through to see the P&L report of the segment.
Final reflections
Learning to build this report for me was not just about navigating myself around PowerBI features; it was an introduction to financial reporting literacy. It helped me understand why every company needs P&L reporting, what the core KPIs are that help readers interpret a business’s financial health status, and the value of integrating PowerBI into internal financial reporting processes. The dual learning curve in PowerBI and finance is what makes this more challenging and more rewarding than what a purely technical implementation could have been.
AI accelerated the process significantly, helping me work through DAX measure logic, data modelling decisions, and dashboard design principles. But the business judgment calls, which KPIs matter, what story the data tells, those require understanding the domain well enough to ask the right questions in the first place. Because in the end, I do believe technical skills and studies are truly valuable when being put into the correct business context, whether it’s building a reliable data pipeline, optimising queries, or building reports.